
Comparative Metabolic Modules!
Introduction
We have collected the documents we need. Click
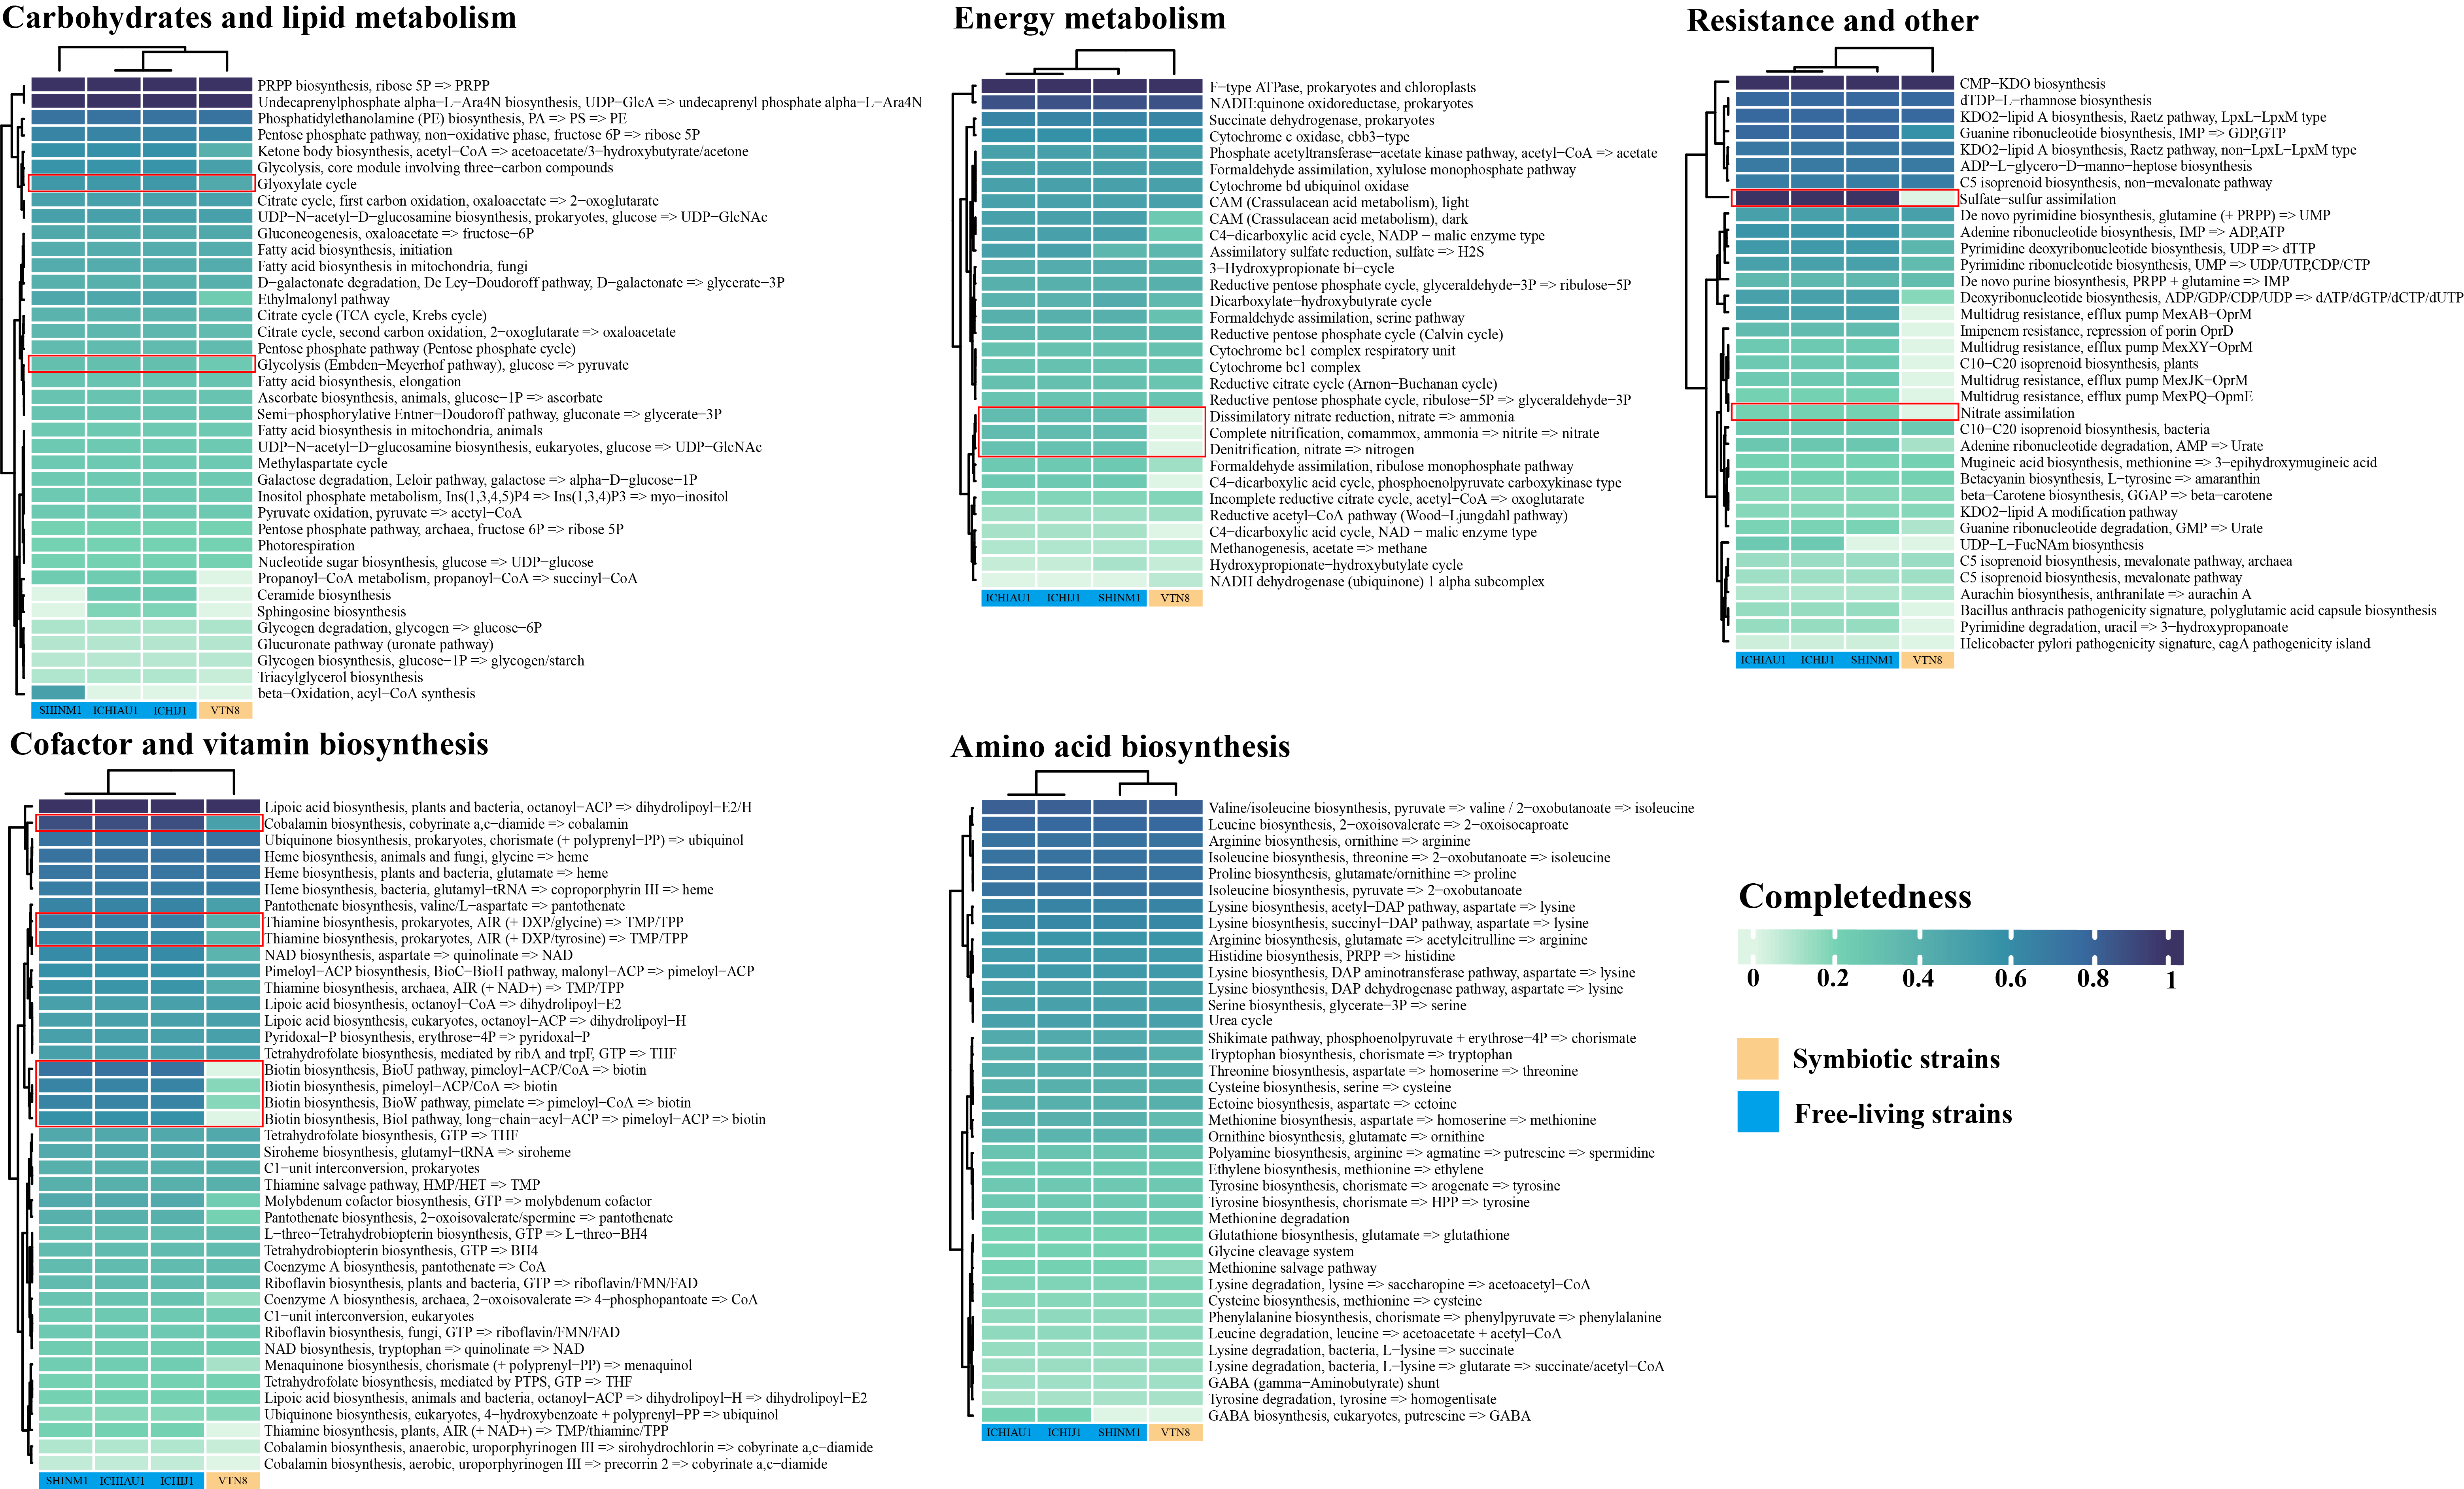
Comparison of metabolic modules by one symbiotic and three free-living bacteria.
Start
These data can be used to analyze differences in metabolic modules between subjects.

But there may be many such folders. The contents of the folder are the same.
One step
query.ko need to be modified. We can unify the process:

#!/usr/bin/env python
# -*- coding: utf-8 -*-
# @Author    : mengqingyao
# @Email     : 15877464851@163.com
# @Time      : 2024/10/24

import os
import argparse
import pandas as pd

# 创建一个解析器
parser = argparse.ArgumentParser(description='处理指定文件夹下的所有 .ko 文件')

# 添加一个参数,指定文件夹路径
parser.add_argument('-f', '--folder_path', type=str, help='要读取的文件夹路径', required=True)

# 添加一个可选参数,设置输出文件的名称
parser.add_argument('-o', '--output_name', type=str, default='output.ko', help='自定义输出文件的名称 (默认: output.ko)')

# 解析命令行参数
args = parser.parse_args()

# 遍历文件夹及其子文件夹
for root, dirs, files in os.walk(args.folder_path):
    for file in files:
        # 检查文件后缀是否为 .ko
        if file.endswith('.ko'):
            # 构建文件的完整路径
            file_path = os.path.join(root, file)
            print(f"处理文件: {file_path}")

            # 读取 .ko 文件中的数据
            # 假设 .ko 文件是以制表符分隔的
            try:
                # 读取数据
                df = pd.read_csv(file_path, sep='\t', header=None, names=['pro_ids', 'ko_ids'])

                # 去除有一列为空的数据
                df = df.dropna()

                # 设置输出文件的名称,保持在同一文件夹中
                output_file_name = os.path.splitext(file)[0] + '_' + args.output_name  # 例如: 原文件名_output.ko
                output_file_path = os.path.join(root, output_file_name)

                # 将处理后的数据保存到新的文件中,使用制表符分隔
                df.to_csv(output_file_path, index=False, header=False, sep='\t')

                print(f"已保存处理后的文件到: {output_file_path}")

            except Exception as e:
                print(f"处理 {file_path} 时发生错误: {e}")
python kegg_module_two.py -f data/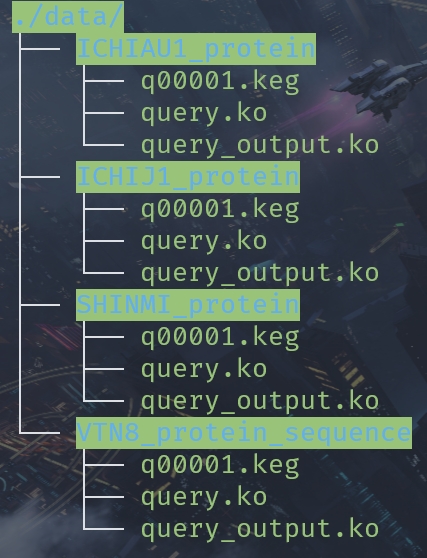
Two step
Demonstrated only once, can be processed multiple times using a for loop.
#!/usr/bin/env python3
# -*- coding: utf-8 -*-

import argparse

# 创建一个参数解析器
parser = argparse.ArgumentParser(description='处理 KEGG 注释和基因列表文件')

# 添加参数
parser.add_argument('-keg','--kaas_keg', type=str, help='输入的 KAAS KEG 文件路径', required=True)
parser.add_argument('-ko','--gene_list', type=str, help='输入的基因列表文件路径', required=True)
parser.add_argument('-g','--gene_anno_result', type=str, help='输出的基因注释结果文件路径')
parser.add_argument('-p','--pathway_anno_result', type=str, help='输出的通路注释结果文件路径')

# 解析命令行参数
args = parser.parse_args()

# 读取基因与蛋白的对应关系列表
gene = {}
with open(args.gene_list, 'r') as gene_list:
    for line in gene_list:
        line = line.strip().split('\t')
        gene[line[0]] = line[1]

# 整理 KAAS 注释列表,得到表格样式,添加基因、蛋白和 KEGG 的对应关系等
kegg = {}
with open(args.gene_anno_result, 'w') as gene_anno:
    gene_anno.write('gene_id\tprotein_id\tko4_id\tko4_gene\tEC\tko3_id\tko3_pathway\tko2_id\tko2_name\tko1_id\tko1_name\n')

    with open(args.kaas_keg, 'r') as kaas:
        for line in kaas:
            line = line.strip()
            if line[0] == 'A' and len(line) > 1:
                ko1_id = line[1:6]
                ko1_name = line[7:len(line)]
            elif line[0] == 'B' and len(line) > 1:
                ko2_id = line[3:8]
                ko2_name = line[9:len(line)]
            elif line[0] == 'C' and len(line) > 1:
                ko3_id = line[5:10]
                ko3_pathway = line[11:len(line)]
                if ' [' in ko3_pathway:
                    ko3_pathway = ko3_pathway.split(' [')[0]
            elif line[0] == 'D' and len(line) > 1:
                ko_detail = line[7:len(line)].split('; ', 1)
                protein_id = ko_detail[0]
                ko4_id = ko_detail[1][0:6]
                ko_detail = ko_detail[1][8:len(ko_detail[1])]
                if ' [' in ko_detail:
                    ko_detail = ko_detail.split(' [')
                    ko4_gene = ko_detail[0]
                    EC = '[' + ko_detail[1]
                else:
                    ko4_gene = ko_detail
                    EC = ''
                if protein_id in gene:
                    gene_anno.write(f'{gene[protein_id]}\t{protein_id}\t{ko4_id}\t{ko4_gene}\t{EC}\t{ko3_id}\t{ko3_pathway}\t{ko2_id}\t{ko2_name}\t{ko1_id}\t{ko1_name}\n')

# 统计注释到各通路的基因数量,以及编辑通路图链接
pathway = {}
with open(args.gene_anno_result, 'r') as gene_anno:
    gene_anno.readline()  # 跳过表头
    for line in gene_anno:
        line = line.strip().split('\t')
        if line[5] not in pathway:
            ko_class = '\t'.join([line[9], line[10], line[7], line[8], line[5], line[6]])
            pathway[line[5]] = [ko_class, [line[0]], [line[2]]]
        else:
            if line[2] not in pathway[line[5]][2]:
                pathway[line[5]][2].append(line[2])
            if line[0] not in pathway[line[5]][1]:
                pathway[line[5]][1].append(line[0])

# 生成通路注释结果文件
with open(args.pathway_anno_result, 'w') as pathway_anno:
    pathway_anno.write('ko1_id\tko1_name\tko2_id\tko2_name\tko3_id\tko3_pathway\tgene_number\tpathway_link\n')
    for key, values in pathway.items():
        gene_number = len(values[1])
        pathway_link = f'https://www.genome.jp/kegg-bin/show_pathway?ko{key}/reference%3dwhite/'
        for ko in values[2]:
            pathway_link += f'{ko}%09orange/'

        pathway_anno.write(f'{values[0]}\t{gene_number}\t{pathway_link}\n')

print(f'处理完成,输出结果保存在: {args.gene_anno_result} 和 {args.pathway_anno_result}')
python kegg_module_there.py -keg ./data/ICHIJ1_protein/q00001.keg -ko ./data/ICHIJ1_protein/query_output.ko -g ./data/ICHIJ1_protein/mqy_gene_anno_result.txt -p ./data/ICHIJ1_protein/mqy_pathway_anno_result.txt
Data Processing and Visualization
With regards to data visualization, there are many GUI
Origin STAMP Pirsm Exceland web visualization tools ImageGP omicshare to choose from. I like R so much, I use it.
rm(list = ls())
library(readr)
library(tidyfst)
library(ComplexHeatmap)
library(viridis)
library(circlize)
library(ggplot2)
library(eoffice)
library(tidyverse)
library(plyr)

# 数据准备 --------------------------------------------------------------------
# KEGG API 所得结果
K_module <- read_delim("KEGG_General_Documentation_module/K_Module.txt", delim = "\t",
                       escape_double = FALSE, col_names = FALSE,
                       trim_ws = TRUE, show_col_types = FALSE)
K_module_sum <- K_module %>% count_dt(X2) %>% rename_dt(m_id = X2,sum_n =n )

#  data文件中,文件夹的名称
file_name <- read_csv("file_name.txt", col_names = FALSE)
file_name <- dput(file_name$X1)

#  读取所有的gene_anno文件
all_gene_ann <- list()
for (i in file_name) {
  filename <- paste0("./",i,"/",i,"_gene_anno_result.txt")
  if (!file.exists(filename)){
    next
  }
  all_gene_ann[[i]] <- read_delim(filename,
                        delim = "\t", escape_double = FALSE,
                        trim_ws = TRUE)
}

#  挑选不重复的K号
single_k <- list()
for (i in 1:4) {
    single_k[[i]] <-  all_gene_ann[[i]]$gene_id[!duplicated(all_gene_ann[[i]]$gene_id)]
}
rm(all_gene_ann,filename)

#  提取各个物种的K号
ICHIAU1_protein <- as.data.frame(single_k[1])
ICHIAU1_protein <- rename(ICHIAU1_protein,c(c..K01810....K00850....K03841....K01624....K01803....K00134...="k_ids")) %>%
  mutate_dt(class = "ICHIAU1_protein")

ICHIJ1_protein <- as.data.frame(single_k[2])
ICHIJ1_protein <- rename(ICHIJ1_protein,c(c..K01810....K00850....K03841....K01624....K01803....K00134...="k_ids")) %>%
  mutate_dt(class = "ICHIJ1_protein")

SHINMI_protein <- as.data.frame(single_k[3])
SHINMI_protein <- rename(SHINMI_protein,c(c..K01810....K00850....K03841....K01624....K01803....K00134...="k_ids")) %>%
  mutate_dt(class = "SHINMI_protein")

VTN8_protein_sequence <- as.data.frame(single_k[4])
names(VTN8_protein_sequence[1])
VTN8_protein_sequence <- rename(VTN8_protein_sequence,c(c..K01810....K03841....K01624....K01803....K00134....K00927...="k_ids")) %>%
  mutate_dt(class = "VTN8_protein_sequence")

#  模块分类和名称
#  KEGG metabolic modules!
# Kegg_module_name_class_one.py处理得到的结果
Module_name_class <- read_delim("./KEGG_General_Documentation_module/Module_name_class.txt",
                                      delim = "\t", escape_double = FALSE,
                                      trim_ws = TRUE, show_col_types = FALSE)
Module_name_class <- Module_name_class %>% select_dt(B_class,m_id,m_name)

rm(file_name)

all_protein <- rbind(ICHIAU1_protein,ICHIJ1_protein,SHINMI_protein,VTN8_protein_sequence)

count(all_protein$class)

rm(ICHIAU1_protein,ICHIJ1_protein,SHINMI_protein,VTN8_protein_sequence,single_k)

#  将K号对应到M号上
K_module <- K_module %>% left_join_dt(all_protein,by = c("X1" = "k_ids"))
K_module <- K_module %>% na.omit("class")

count(K_module$class)


K_module_ICHIAU1_protein <- K_module %>% filter_dt(class == "ICHIAU1_protein") %>% select_dt(m_id = X2,class)
K_module_ICHIJ1_protein <- K_module %>% filter_dt(class == "ICHIJ1_protein") %>% select_dt(m_id = X2,class)
K_module_SHINMI_protein <- K_module %>% filter_dt(class == "SHINMI_protein") %>% select_dt(m_id = X2,class)
K_module_VTN8_protein_sequence <- K_module %>% filter_dt(class == "VTN8_protein_sequence") %>% select_dt(m_id = X2,class)

#m <- K_module %>% filter_dt(class == "VTN8_protein_sequence")

K_module_ICHIAU1_protein_sum <- K_module_ICHIAU1_protein %>% count_dt(m_id) %>% rename_dt(ICHIAU1_protein = n)
K_module_ICHIJ1_protein_sum <- K_module_ICHIJ1_protein %>% count_dt(m_id) %>% rename_dt(ICHIJ1_protein = n)
K_module_SHINMI_protein_sum <- K_module_SHINMI_protein %>% count_dt(m_id) %>% rename_dt(SHINMI_protein = n)
K_module_VTN8_protein_sequence_sum <- K_module_VTN8_protein_sequence %>% count_dt(m_id) %>% rename_dt(VTN8_protein_sequence = n)

rm(all_protein,K_module_ICHIAU1_protein,K_module_ICHIJ1_protein,K_module_SHINMI_protein,K_module_VTN8_protein_sequence)

#  各个物种模块中的基因和模块中的总基因的比例
result <- K_module_sum %>% left_join_dt(K_module_ICHIAU1_protein_sum) %>%
  left_join_dt(K_module_ICHIJ1_protein_sum) %>%
  left_join_dt(K_module_SHINMI_protein_sum) %>%
  left_join_dt(K_module_VTN8_protein_sequence_sum) %>%
  mutate_dt(ICHIAU1_ratio = ICHIAU1_protein/sum_n) %>%
  mutate_dt(ICHIJ1_ratio = ICHIJ1_protein/sum_n) %>%
  mutate_dt(SHINMI_ratio = SHINMI_protein/sum_n) %>%
  mutate_dt(VTN8_ratio = VTN8_protein_sequence/sum_n) %>%
  select_dt(m_id,ICHIAU1_ratio,ICHIJ1_ratio,SHINMI_ratio,VTN8_ratio)

rm(K_module_sum,K_module,K_module_ICHIJ1_protein_sum,K_module_SHINMI_protein_sum,K_module_ICHIAU1_protein_sum,K_module_VTN8_protein_sequence_sum)

#  模块分类
result <- result %>% merge(Module_name_class) %>%
  replace_na_dt(to = 0)
rm(Module_name_class)


#  模块大类的总数量
B_class <- result %>%  count_dt(B_class)

# 自定义颜色 --------------------------------------------------------------------
#col_fun = colorRamp2(c(0, 0.5, 1), c( "white","green","red"))
col_fun = colorRamp2(c(0, 0.2, 0.6, 0.8, 1), c("#def5e5", "#74d1b2","#3591a7","#37699e","#3c3365"))

# Amino acid biosynthesis -------------------------------------------------
#  数据
Amino_acid <- result %>% filter_dt(B_class == "Amino acid metabolism") %>%
  filter_dt(ICHIAU1_ratio != 0 | ICHIJ1_ratio != 0 | SHINMI_ratio != 0 | VTN8_ratio != 0)
#  自定义列名
row_labels_Amino_acid <- structure(Amino_acid$m_name, names = paste0(1:38))
#  绘图数据
metabolize_amino <- Amino_acid %>% select_dt(-B_class,-m_name,-m_id)
metabolize_amino <- as.matrix(metabolize_amino)
#  赋予列因子信息
rownames(metabolize_amino) = rownames(Amino_acid)

#  绘制热图
p1 <- Heatmap(metabolize_amino,
              col = col_fun,
              #col = RColorBrewer::brewer.pal(9,"Blues"),
              #col = RColorBrewer::brewer.pal(4,"Accent"),
              #viridis(alpha = 0.5,10, begin = 1, end = 0,option = "G"),
              #plasma(6, begin = 1, end = 0),
              #cividis(5, begin = 0, end = 1),
              name = "Completedness",
              column_title = "Amino acid biosynthesis",
              rect_gp = gpar(col = "white", lty = 1, lwd = 2),
              row_title_side = "right",
              row_dend_width = unit(1, "cm"),
              column_dend_height = unit(0.5, "cm"),
              row_names_centered = TRUE,
              column_names_centered = TRUE,
              column_names_rot = 360,
              row_labels = row_labels_Amino_acid[rownames(metabolize_amino)],
              row_names_gp = gpar(fontsize = 6),
              column_names_gp= gpar(fontsize = 8))

# Carbohydrates and lipid metabolism -----------------------------------
#  数据
Carbohydrate <- result[result[,which(result$B_class == "Carbohydrate metabolism")],]
Lipid <- result[result[,which(result$B_class == "Lipid metabolism")],]
Carbohydrate_Lipid <- rbind(Carbohydrate,Lipid)

#  绘图数据
metabolize_Car_lipid <- Carbohydrate_Lipid %>% select_dt(-B_class,-m_id) %>%
  filter_dt(ICHIAU1_ratio != 0 | ICHIJ1_ratio != 0 | SHINMI_ratio != 0 | VTN8_ratio != 0)
metabolize_Car_lipid  <- as.data.frame(metabolize_Car_lipid)

0#  自定义列名
row_labels_Car_lipid = structure(metabolize_Car_lipid$m_name, names = paste0(1:38))
rm(Carbohydrate,Lipid)

metabolize_Car_lipid_matrix <- metabolize_Car_lipid %>% select_dt(-m_name) %>% as.matrix()

#  赋予列因子信息
rownames(metabolize_Car_lipid_matrix) = rownames(metabolize_Car_lipid)

p2 <- Heatmap(metabolize_Car_lipid_matrix,
        #viridis(alpha = 0.5,10, begin = 1, end = 0,option = "G"),
        col = col_fun,
        name = "Completedness",
        column_title = "Carbohydrates and lipid metabolism",
        rect_gp = gpar(col = "white", lty = 1, lwd = 2),
        row_title_side = "right",
        row_dend_width = unit(1, "cm"),
        column_dend_height = unit(0.5, "cm"),
        row_names_centered = TRUE,
        column_names_centered = TRUE,
        column_names_rot = 360,
        row_labels = row_labels_Car_lipid[rownames(metabolize_Car_lipid)],
        row_names_gp = gpar(fontsize = 6),
        column_names_gp= gpar(fontsize = 8))
# dev.off()

# Cofactor and vitamin biosynthesis ---------------------------------------
#  数据
result_cofa_vita <- result %>% filter_dt(B_class == "Metabolism of cofactors and vitamins") %>%
  filter_dt(ICHIAU1_ratio != 0 | ICHIJ1_ratio != 0 | SHINMI_ratio != 0 | VTN8_ratio != 0)
#  自定义列名
row_labels_cofa_vita <- structure(result_cofa_vita$m_name,names = paste0(1:41))
#  绘图数据
metabolize_cofa_vita <- result_cofa_vita %>% select_dt(-B_class,-m_name,-m_id)
metabolize_cofa_vita <- as.matrix(metabolize_cofa_vita)
#  赋予列因子信息
rownames(metabolize_cofa_vita) <- rownames(result_cofa_vita)

p3 <- Heatmap(metabolize_cofa_vita,
        #viridis(alpha = 0.5,10, begin = 1, end = 0,option = "G"),
        col = col_fun,
        name = "Completedness",
        column_title = "Cofactor and vitamin biosynthesis",
        rect_gp = gpar(col = "white", lty = 1, lwd = 2),
        row_title_side = "right",
        row_dend_width = unit(1, "cm"),
        column_dend_height = unit(0.5, "cm"),
        row_names_centered = TRUE,
        column_names_centered = TRUE,
        column_names_rot = 360,
        row_labels = row_labels_cofa_vita[rownames(metabolize_cofa_vita)],
        row_names_gp = gpar(fontsize = 6),
        column_names_gp= gpar(fontsize = 8))

# Energy metabolism -------------------------------------------------------
#  数据
result_Energy <- result %>% filter_dt(B_class == "Energy metabolism") %>%
  filter_dt(ICHIAU1_ratio != 0 | ICHIJ1_ratio != 0 | SHINMI_ratio != 0 | VTN8_ratio != 0)
#  自定义列名
row_labels_Energy = structure(result_Energy$m_name, names = paste0(1:31))
#  绘图数据
metabolize_Energy <- result_Energy %>% select_dt(-B_class,-m_name,-m_id)
metabolize_Energy <- as.matrix(metabolize_Energy)
#  赋予列因子信息
rownames(metabolize_Energy) <- rownames(result_Energy)

p4 <- Heatmap(metabolize_Energy,
        #viridis(alpha = 0.5,10, begin = 1, end = 0,option = "G"),
        col = col_fun,
        name = "Completedness",
        column_title = "Energy metabolism",
        rect_gp = gpar(col = "white", lty = 1, lwd = 2),
        row_title_side = "right",
        row_dend_width = unit(1, "cm"),
        column_dend_height = unit(0.5, "cm"),
        row_names_centered = TRUE,
        column_names_centered = TRUE,
        column_names_rot = 360,
        row_labels = row_labels_Energy[rownames(metabolize_Energy)],
        row_names_gp = gpar(fontsize = 5),
        column_names_gp= gpar(fontsize = 8))

# Resistance and other ----------------------------------------------------
#  合并剩余数据
result_1 <- result %>% filter_dt(B_class == "Biosynthesis of other secondary metabolites")
result_2 <- result %>% filter_dt(B_class == "Biosynthesis of terpenoids and polyketides")
result_3 <- result %>% filter_dt(B_class == "Gene set")
result_4 <- result %>% filter_dt(B_class == "Xenobiotics biodegradation")
result_5 <- result %>% filter_dt(B_class == "Nucleotide metabolism")
result_6 <- result %>% filter_dt(B_class == "Module set")
result_7 <- result %>% filter_dt(B_class == "Glycan metabolism")
result_1_7 <- rbind(result_1,result_2,result_3,result_4,result_5,result_6,result_7) %>%
  filter_dt(ICHIAU1_ratio != 0 | ICHIJ1_ratio != 0 | SHINMI_ratio != 0 | VTN8_ratio != 0)
#  自定义列名
row_labels_other = structure(result_1_7$m_name, names = paste0(1:35))
rm(result_1,result_2,result_3,result_4,result_5,result_6,result_7)
#  绘图数据
metabolize_other <- result_1_7 %>% select_dt(-B_class,-m_name,-m_id)
metabolize_other <- as.matrix(metabolize_other)
#  行注释信息
rownames(metabolize_other) = rownames(result_1_7)

p5 <- Heatmap(metabolize_other,
        #viridis(alpha = 0.5,10, begin = 1, end = 0,option = "G"),
        col = col_fun,
        name = "Completedness",
        column_title = "Resistance and other",
        rect_gp = gpar(col = "white", lty = 1, lwd = 2),
        row_title_side = "right",
        row_dend_width = unit(1, "cm"),
        column_dend_height = unit(0.5, "cm"),
        row_names_centered = TRUE,
        column_names_centered = TRUE,
        column_names_rot = 360,
        row_labels = row_labels_other[rownames(metabolize_other)],
        row_names_gp = gpar(fontsize = 6),
        column_names_gp= gpar(fontsize = 8))
rm(result_1_7,Amino_acid,Carbohydrate_Lipid,result_Energy,result_cofa_vita,result)
I wrote this script a long time ago, and there is a lot of redundant code, but this is the original processing logic, and I'll update it with new code later.
Beautification
- I would suggest saving the image as a pdf.
- Use Adobe Illustrator to evolve and beautify.
- Save images as needed.
Result
For more details, you can check out: Paper
Quote
Email me with more questions! 584338215@qq.com